Market Outlook
September 1, 2016
Market Cues
Domestic Indices
Chg (%)
(Pts)
(Close)
Indian markets are expected to open flat.
BSE Sensex
0.4
109
28,452
Nifty
0.5
42
8,786
Interest Rate Uncertainty Continues To Weigh On Wall Street.After coming under
pressure in morning trading on Wednesday, stocks regained some ground in the
Mid Cap
0.4
49
13,217
afternoon but remained stuck in the red. With the lower close on the day, the major
Small Cap
0.2
23
12,649
averages added to the losses posted in the previous session. Stocks have moved
Bankex
1.2
269
22,657
mostly lower during trading on Wednesday, adding to the losses posted in the
previous session. On the final day of trading for August, the major averages are
Global Indices
Chg (%)
(Pts)
(Close)
turning in a mixed performance for the month.
Dow Jones
(0.3)
(53)
18,401
U.K. shares reversed early losses Tuesday after a survey from the
Confederation of British Industry showed business volumes were unchanged in
Nasdaq
(0.2)
(10)
5,213
the three months to August for business and professional services despite the
FTSE
(0.6)
(39)
6781
pessimistic outlook following the U.K.'s vote to leave the European Union. The
Nikkei
1.0
162
16,887
business lobby group found that optimism slumped in the services sector but the
Hang Seng
(0.2)
(39)
22,977
impact on day-to-day business so far has been "relatively modest."
Shanghai Com
0.4
11
3,085
CAC 40 Rebounds On Fed Hike Skepticism French shares rose sharply on
Tuesday, as oil prices rebounded from overnight losses and investors pared
back expectations that the U.S.
Advances / Declines
BSE
NSE
Advances
1,326
752
Indian market saw strong buying across the board. Infrastructure companies witness
heavy buying by investors after news of Govt’s plan to push up the stalled projects.
Declines
1,387
848
Banking counters also witness some amount of buying. Market may remain range
Unchanged
210
74
bound in the near term and a lack major cues.
Volumes (` Cr)
News Analysis
CCI slaps `6,700cr fine on 11 cement companies
BSE
3,458
Detailed analysis on Pg2
NSE
37,933
Investor’s Ready Reckoner
Net Inflows (` Cr)
Net
Mtd
Ytd
Key Domestic & Global Indicators
FII
558
8,474
39,356
Stock Watch: Latest investment recommendations on 150+ stocks
MFs
274
1,320
10,109
Refer Pg5 onwards
Top Picks
Top Gainers
Price (`)
Chg (%)
CMP
Target
Upside
Company
Sector
Rating
Hcc
28
19.8
(`)
(`)
(%)
Amara Raja
Auto/Auto Ancillary Accumulate
957
1,076
12.4
Punjlloyd
23
11.6
HCL Tech
IT
Buy
779
1,000
28.3
Idfc
63
8.8
HDFC Bank
Financials
Accumulate
1,291
1,350
4.6
Sreinfra
82
8.2
Bharat Electronics
Capital Goods
Buy
1,220
1,414
15.9
Pfc
123
7.7
Equitas Holdings
Financials
Buy
178
235
31.9
Navkar Corporation Others
Buy
197
265
34.5
More Top Picks on Pg3
Top Losers
Price (`)
Chg (%)
Deltacorp
155
(4.9)
Key Upcoming Events
Dlf
155
(4.3)
Previous
Consensus
Date
Region
Event Description
Reading
Expectations
Kscl
360
(3.4)
Sep 01 US
Initial Jobless claims
261.0
265.0
Icra
3,831
(3.3)
Sep 01 UK
PMI Manufacturing
48.2
49.0
Nationalum
47
(3.1)
Sep 01 China
PMI Manufacturing
49.9
49.8
As on August 31, 2016
Sep 02 US
Change in Nonfarm payrolls
255.0
180.0
Sep 05 US
Unemployment rate
4.9
4.8
6.(
More Events on Pg4
Market Outlook
September 1, 2016
News Analysis
CCI Slaps `6,700cr fine on 11 Cement Companies.
The competition commission of India has imposed a combined penalty of
`6,700cr on 11 cement companies for cartelisation. The latest order has been
passed by the commission following the directions from the Competition Appellate
Tribunal (COMPAT) which had remanded the matter involving the CII. While it is a
negative development for the cement companies, they also have a legal recourse
and can appeal at higher courts for that. Further the matter had been lingering for
many years but there has been no direct impact on the pricing by the cement
companies. While there could be knee jerk reaction to the names involved, some
of the cement companies are having strong balance sheet which can pay the
penalty without getting impacted in a big way. While there are few names which
have a stretched balance sheet and any further cash outflow could impact their
profitability in the near term.
Economic and Political News
Gas prices for power projects may further fall
GDP growth for Q1FY17 at 7.1%, lower than expected
Corporate News
Shah Panel says RIL must pay penalty to Govt
GVK Power Q1FY17 net loss up at `51cr
HDFC opens second tranches of Masala Bond
Tata Power to make Javelin missile with Lockheed Martin JV
Market Outlook
September 1, 2016
Top Picks ★★★★★
Large Cap
Market Cap
CMP
Target
Upside
Company
Rationale
(` Cr)
(`)
(`)
(%)
To outpace battery industry growth due to better technological
Amara Raja Batteries
16,350
957
1,076
12.4
products leading to market share gains in both the automotive
OEM and replacement segments.
Uptick in defense capex by government, coupled with BELs
Bharat Electronics
29,291
1,220
1,414
15.9
strong market positioning, indicate good times ahead for BEL.
HCL Tech
1,09,926
779
1,000
28.3
Stock is trading at attractive valuations & factors all bad news.
Strong visibility for a robust 20% earnings trajectory, coupled
HDFC Bank
3,26,784
1,291
1,350
4.6
with high quality of earnings on account of high quality retail
business and strategic focus on highly rated corporates.
Back on the growth trend, expect a long term growth of 14% to
Infosys
2,38,147
1,037
1,370
32.1
be a US$20bn in FY2020.
Source: Company, Angel Research
Mid Cap
Market Cap
CMP
Target
Upside
Company
Rationale
(` Cr)
(`)
(`)
(%)
Favourable outlook for the AC industry to augur well for
Cooling products business which is out pacing the market
Blue Star
4,775
501
527
5.2
growth. EMPPAC division's profitability to improve once
operating environment turns around.
Strong loan growth backed by diversified loan portfolio and
Equitas Holdings
5,976
178
235
31.9
adequate CAR. ROE & ROA likely to remain decent as risk of
dilution remains low. Attractive valuations considering growth.
Expectations of above average monsoon augurs well for
Goodyear India
1,296
562
631
12.3
Goodyear India as it derives ~50% of its turnover from farm
tyre segment.
Commencement of new projects, downtrend in the interest rate
IL&FS Transport
2,428
74
93
26.0
cycle, to lead to stock re-rating
Economic recovery to have favourable impact on advertising &
Jagran Prakashan
6,223
190
205
7.7
circulation revenue growth. Further, the acquisition of a radio business
(Radio City) would also boost the company`s revenue growth.
Speedier execution and speedier sales, strong revenue visibility
Mahindra Lifespace
1,776
433
522
20.6
in short-to-long run, attractive valuations
Massive capacity expansion along with rail advantage at ICD as
Navkar Corporation
2,809
197
265
34.5
well CFS augurs well for the company
Earnings boost on back of stable material prices and favourable
Radico Khaitan
1,391
105
125
19.6
pricing environment. Valuation discount to peers provides
additional comfort
Market leadership in Hindi news genre and no. 2 viewership
TV Today Network
1,837
308
363
17.9
ranking in English news genre, exit from the radio business, and
anticipated growth in ad spends by corporates to benefit the stock.
Source: Company, Angel Research
Market Outlook
September 01, 2016
Key Upcoming Events
Result Calendar
Date
Company
Sep 3, 2016
Bhushan Steel
Sep 5, 2016
Petronet LNG
Sep 7, 2016
BHEL, ONGC
Sep 8, 2016
SAIL
Sep 9, 2016
Nalco, GSPL
Source: Bloomberg, Angel Research
Global economic events release calendar
Date
Time
Country
Event Description
Unit
Period
Bloomberg Data
Last Reported Estimated
Sep 1, 2016
6:00PM US
Initial Jobless claims
Thousands
Aug 27
261.00
265.00
2:00PM UK
PMI Manufacturing
Value
Aug
48.20
49.00
1:25PM Germany
PMI Manufacturing
Value
Aug F
53.60
53.60
6:30AM China
PMI Manufacturing
Value
Aug
49.90
49.80
Sep 2, 2016
1:25PM Germany
PMI Services
Value
Aug F
53.30
--
6:00PM US
Change in Nonfarm payrolls
Thousands
Aug
255.00
180.00
Sep 5, 2016
6:00PM US
Unnemployment rate
%
Aug
4.90
4.80
Sep 6, 2016
2:30PM Euro Zone
Euro-Zone GDP s.a. (QoQ)
% Change
2Q F
0.30
--
Sep 7, 2016
2:00PM UK
Industrial Production (YoY)
% Change
Jul
1.60
--
Sep 8, 2016
China
Exports YoY%
% Change
Aug
(4.40)
--
5:15PM Euro Zone
ECB announces interest rates
%
Sep 8
--
--
Sep 9, 2016
India
Imports YoY%
% Change
Aug
(19.03)
--
India
Exports YoY%
% Change
Aug
(6.84)
--
7:00AM China
Consumer Price Index (YoY)
% Change
Aug
1.80
--
Sep 12, 2016 5:30PM India
Industrial Production YoY
% Change
Jul
2.10
--
Sep 13, 2016 2:00PM UK
CPI (YoY)
% Change
Aug
0.60
--
2:00PM UK
Jobless claims change
% Change
Aug
(8.60)
--
Sep 14, 2016 7:30AM China
Industrial Production (YoY)
% Change
Aug
6.00
--
12:00PM India
Monthly Wholesale Prices YoY%
% Change
Aug
3.55
--
Sep 15, 2016 2:30PM Euro Zone
Euro-Zone CPI (YoY)
%
Aug F
0.20
--
6:45PM US
Industrial Production
%
Aug
0.74
--
US
Producer Price Index (mom)
% Change
Aug
(0.50)
--
4:30PM UK
BOE Announces rates
% Ratio
Sep 15
0.25
--
Sep 16, 2016 6:00PM US
Consumer price index (mom)
% Change
Aug
--
--
Source: Bloomberg, Angel Research
Market Outlook
September 01, 2016
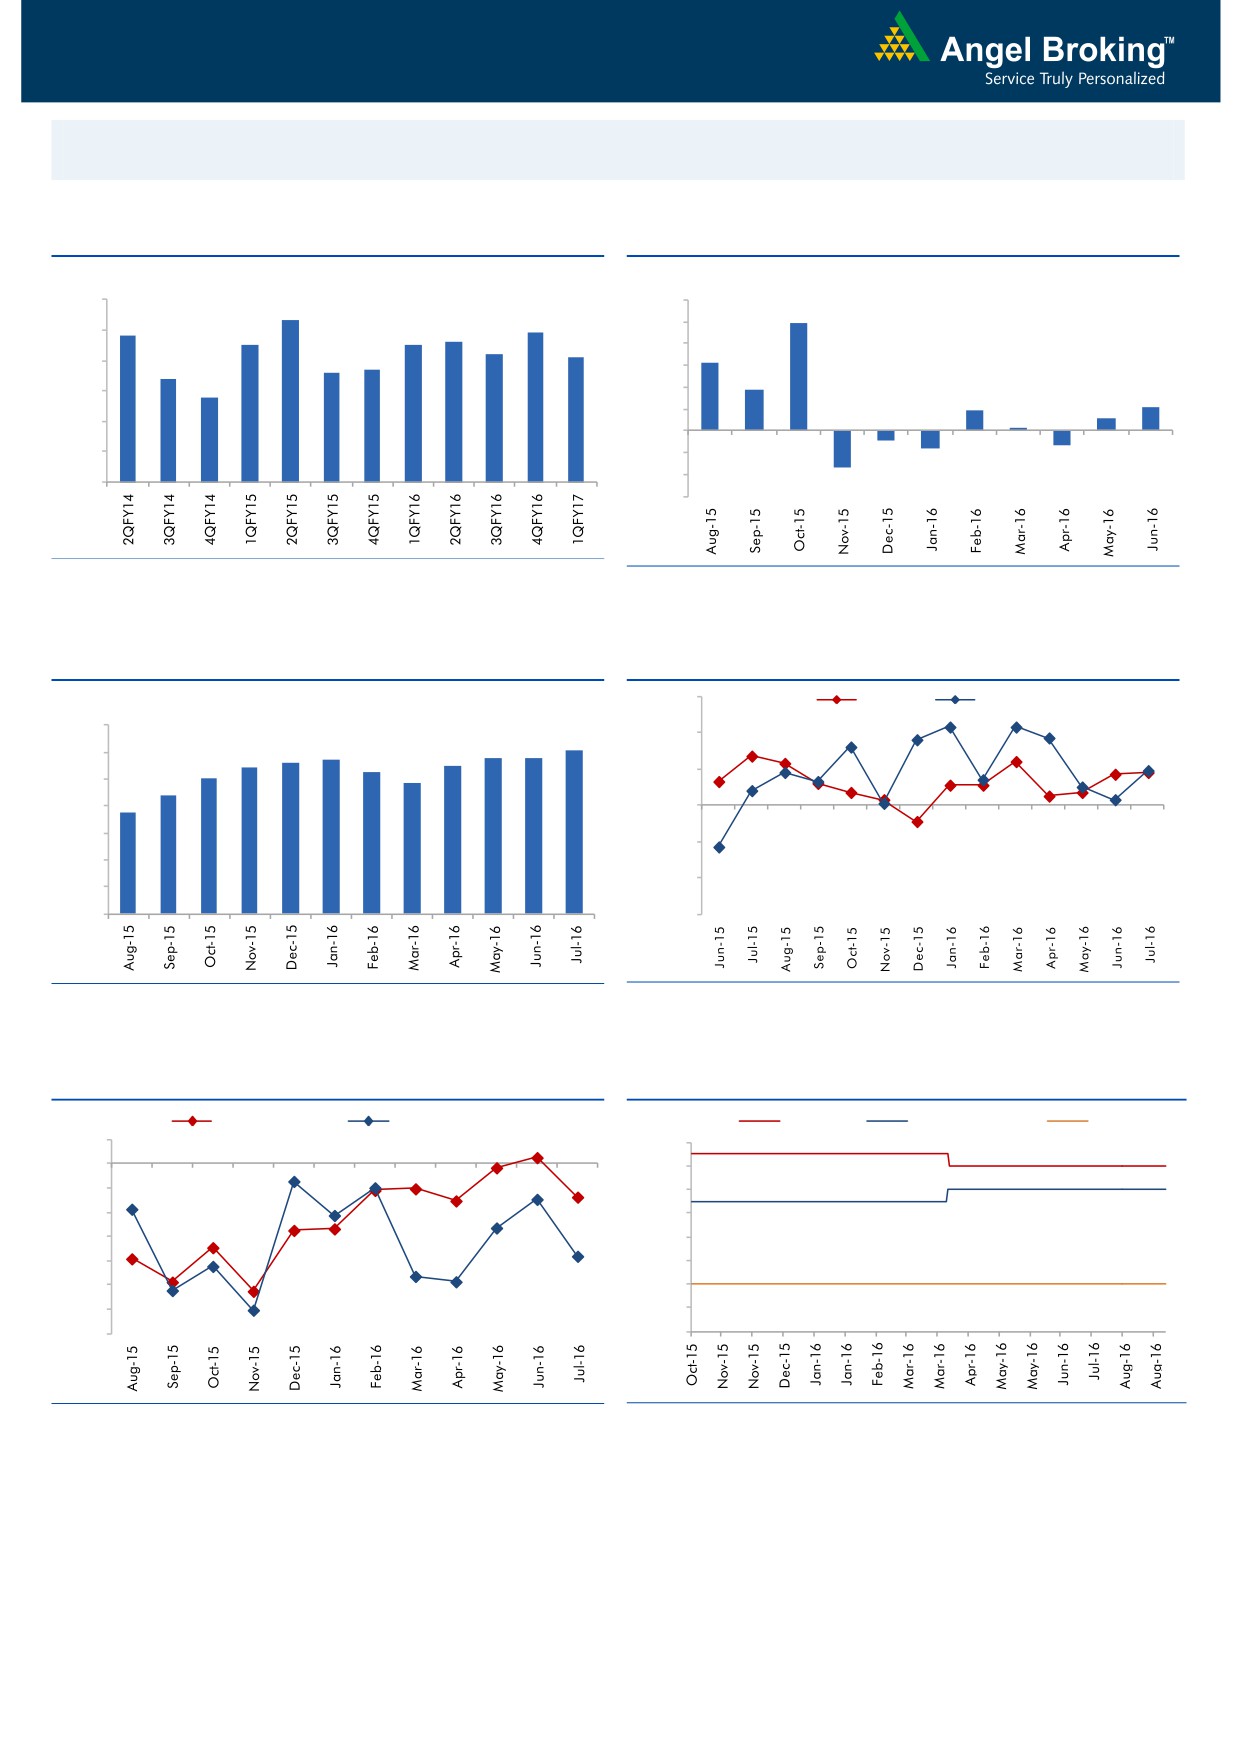
Macro watch
Exhibit 1: Quarterly GDP trends
Exhibit 2: IIP trends
(%)
(%)
9.0
8.3
12.0
9.9
7.8
7.9
10.0
8.0
7.5
7.5
7.6
7.2
7.1
8.0
6.3
6.6
6.7
7.0
6.4
6.0
3.7
5.8
4.0
2.1
6.0
1.9
1.1
2.0
0.3
5.0
-
4.0
(2.0)
(0.9)
(1.3)
(1.6)
(4.0)
3.0
(3.4)
(6.0)
Source: CSO, Angel Research
Source: MOSPI, Angel Research
Exhibit 3: Monthly CPI inflation trends
Exhibit 4: Manufacturing and services PMI
56.0
Mfg. PMI
Services PMI
(%)
7.0
6.1
54.0
5.7
5.8
5.8
5.4
5.6
5.5
6.0
5.3
5.0
4.8
52.0
5.0
4.4
3.7
4.0
50.0
3.0
48.0
2.0
46.0
1.0
-
44.0
Source: MOSPI, Angel Research
Source: Market, Angel Research; Note: Level above 50 indicates expansion
Exhibit 5: Exports and imports growth trends
Exhibit 6: Key policy rates
(%)
Exports yoy growth
Imports yoy growth
(%)
Repo rate
Reverse Repo rate
CRR
5.0
7.00
0.0
6.50
(5.0)
6.00
(10.0)
5.50
(15.0)
5.00
(20.0)
4.50
(25.0)
4.00
(30.0)
3.50
(35.0)
3.00
Source: Bloomberg, Angel Research
Source: RBI, Angel Research
Market Outlook
September 01, 2016
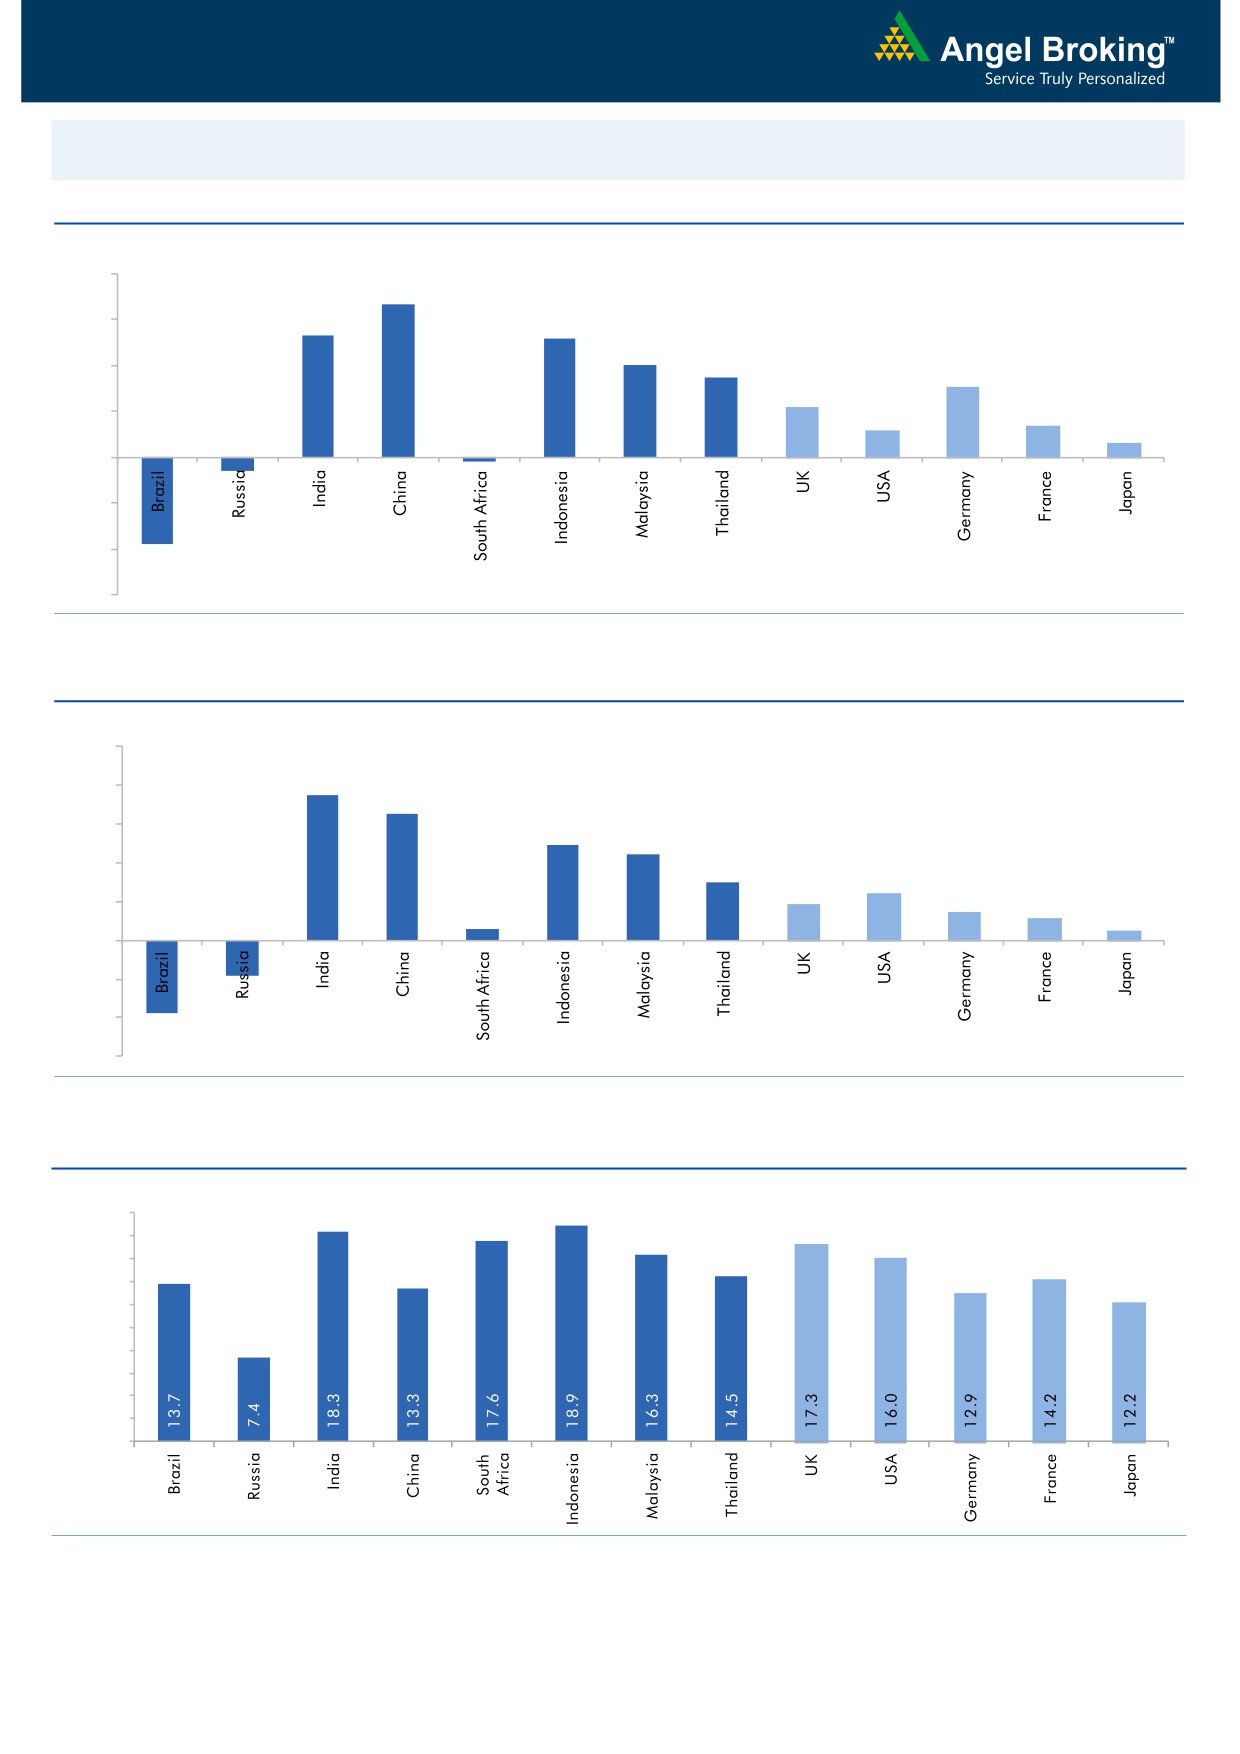
Global watch
Exhibit 1: Latest quarterly GDP Growth (%, yoy) across select developing and developed countries
(%)
8.0
6.7
6.0
5.3
5.2
4.0
3.5
4.0
3.1
2.2
1.4
2.0
1.2
0.6
-
(2.0)
(0.6)
(4.0)
(3.8)
(0.2)
(6.0)
Source: Bloomberg, Angel Research
Exhibit 2: 2016 GDP Growth projection by IMF (%, yoy) across select developing and developed countries
(%)
10.0
7.5
8.0
6.5
6.0
4.9
4.4
4.0
3.0
2.4
1.9
1.5
2.0
1.1
0.6
0.5
(3.8)
(1.8)
-
(2.0)
(4.0)
(6.0)
Source: IMF, Angel Research
Exhibit 3: One year forward P-E ratio across select developing and developed countries
(x)
20.0
18.0
16.0
14.0
12.0
10.0
8.0
6.0
4.0
2.0
-
Source: IMF, Angel Research
Market Outlook
September 01, 2016
Exhibit 4: Relative performance of indices across globe
Returns (%)
Country
Name of index
Closing price
1M
3M
1YR
Brazil
Bovespa
57,901
2.0
16.1
25.8
Russia
Micex
1,972
1.2
4.1
13.8
India
Nifty
8,786
1.7
7.7
12.5
China
Shanghai Composite
3,085
3.6
5.6
(4.1)
South Africa
Top 40
46,261
(0.3)
(4.5)
4.2
Mexico
Mexbol
47,541
1.6
4.5
10.6
Indonesia
LQ45
925
(0.8)
11.9
26.3
Malaysia
KLCI
1,678
1.5
2.5
6.6
Thailand
SET 50
983
2.6
7.6
10.8
USA
Dow Jones
18,401
(0.0)
3.4
12.5
UK
FTSE
6,782
1.5
9.5
12.1
Japan
Nikkei
16,887
1.5
(2.0)
(17.3)
Germany
DAX
10,593
2.5
3.8
5.5
France
CAC
4,438
0.7
(0.6)
(4.9)
Source: Bloomberg, Angel Research
Stock Watch
September 01, 2016
Company Name
Reco
CMP
Target
Mkt Cap
Sales ( Čcr )
OPM(%)
EPS (Č)
PER(x)
P/BV(x)
RoE(%)
EV/Sales(x)
(Č)
Price ( Č)
( Č cr )
FY17E FY18E
FY17E
FY18E
FY17E
FY18E
FY17E
FY18E
FY17E
FY18E
FY17E
FY18E
FY17E
FY18E
Agri / Agri Chemical
Rallis
Neutral
227
-
4,412
1,937
2,164
13.3
14.3
9.0
11.0
25.2
20.6
4.4
3.8
18.4
19.8
2.3
2.0
United Phosphorus
Accumulate
638
684
27,356
15,176
17,604
18.5
18.5
37.4
44.6
17.1
14.3
3.4
2.8
21.4
21.2
1.9
1.6
Auto & Auto Ancillary
Ashok Leyland
Buy
88
111
24,958
22,407
26,022
10.6
10.6
5.2
6.4
16.8
13.7
3.8
3.2
23.6
24.7
1.2
1.0
Bajaj Auto
Neutral
2,981
-
86,259
25,093
27,891
19.5
19.2
143.9
162.5
20.7
18.4
5.8
5.0
30.3
29.4
3.2
2.8
Bharat Forge
Neutral
851
-
19,803
7,726
8,713
20.5
21.2
35.3
42.7
24.1
19.9
4.5
4.0
18.9
20.1
2.7
2.3
Eicher Motors
Neutral
22,751
-
61,794
16,583
20,447
17.5
18.0
598.0
745.2
38.1
30.5
13.0
9.9
41.2
38.3
3.6
2.9
Gabriel India
Neutral
118
-
1,698
1,544
1,715
9.0
9.3
5.4
6.3
21.9
18.8
4.1
3.7
18.9
19.5
1.0
0.9
Hero Motocorp
Neutral
3,548
-
70,839
31,253
35,198
15.3
15.0
172.3
192.1
20.6
18.5
7.5
6.5
38.9
37.0
2.1
1.8
Jamna Auto Industries Neutral
221
-
1,768
1,486
1,620
9.8
9.9
15.0
17.2
14.8
12.9
3.2
2.7
21.8
21.3
1.3
1.2
L G Balakrishnan & Bros Neutral
475
-
746
1,302
1,432
11.6
11.9
43.7
53.0
10.9
9.0
1.5
1.4
13.8
14.2
0.7
0.6
Mahindra and Mahindra Neutral
1,438
-
89,313
46,534
53,077
11.6
11.7
67.3
78.1
21.4
18.4
3.5
3.0
15.4
15.8
1.9
1.6
Maruti
Neutral
5,053
-
152,631
69,186
82,217
14.7
14.4
198.5
241.4
25.5
20.9
5.0
4.0
20.2
20.0
1.9
1.5
Minda Industries
Neutral
1,262
-
2,003
2,728
3,042
9.0
9.1
68.2
86.2
18.5
14.6
4.2
3.3
23.8
24.3
0.8
0.7
Motherson Sumi
Neutral
323
-
42,665
45,896
53,687
7.8
8.3
13.0
16.1
24.7
20.0
8.0
6.4
34.7
35.4
1.0
0.8
Rane Brake Lining
Neutral
798
-
631
511
562
11.3
11.5
28.1
30.9
28.4
25.8
4.3
3.9
15.3
15.0
1.3
1.2
Setco Automotive
Neutral
45
-
595
741
837
13.0
13.0
15.2
17.0
2.9
2.6
0.5
0.4
15.8
16.3
1.2
1.1
Tata Motors
Neutral
537
-
155,173
300,209
338,549
8.9
8.4
42.7
54.3
12.6
9.9
2.0
1.7
15.6
17.2
0.6
0.5
TVS Motor
Neutral
326
-
15,481
13,390
15,948
6.9
7.1
12.8
16.5
25.5
19.7
6.4
5.0
26.3
27.2
1.2
1.0
Amara Raja Batteries
Buy
957
1,076
16,350
5,717
6,733
18.7
18.9
38.4
48.9
25.0
19.6
6.2
5.0
25.3
24.8
2.6
2.2
Exide Industries
Neutral
185
-
15,755
7,439
8,307
15.0
15.0
8.1
9.3
22.9
19.9
3.2
2.9
14.3
16.7
1.7
1.5
Apollo Tyres
Neutral
183
-
9,315
12,877
14,504
14.3
13.9
21.4
23.0
8.5
8.0
1.3
1.2
16.4
15.2
0.9
0.8
Ceat
Buy
894
1,119
3,617
7,524
8,624
13.0
12.7
131.1
144.3
6.8
6.2
1.3
1.1
19.8
18.6
0.6
0.5
JK Tyres
Neutral
132
-
2,993
7,455
8,056
15.0
15.0
21.8
24.5
6.1
5.4
1.3
1.0
22.8
21.3
0.5
0.4
Swaraj Engines
Neutral
1,165
-
1,447
660
810
15.2
16.4
54.5
72.8
21.4
16.0
6.7
6.0
31.5
39.2
2.0
1.6
Subros
Neutral
107
-
640
1,488
1,681
11.7
11.9
6.4
7.2
16.7
14.9
1.8
1.6
10.8
11.4
0.6
0.5
Indag Rubber
Neutral
185
-
487
286
326
19.8
16.8
11.7
13.3
15.9
13.9
2.7
2.5
17.8
17.1
1.4
1.2
Capital Goods
ACE
Neutral
46
-
453
709
814
4.1
4.6
1.4
2.1
32.7
21.8
1.4
1.3
4.4
6.0
0.8
0.7
BEML
Accumulate
1,065
1,157
4,437
3,451
4,055
6.3
9.2
31.4
57.9
33.9
18.4
2.0
1.9
6.3
10.9
1.4
1.2
Bharat Electronics
Buy
1,220
1,414
29,291
8,137
9,169
16.8
17.2
58.7
62.5
20.8
19.5
3.2
2.9
44.6
46.3
2.6
2.3
Stock Watch
September 01, 2016
Company Name
Reco
CMP
Target
Mkt Cap
Sales ( Čcr )
OPM(%)
EPS (Č)
PER(x)
P/BV(x)
RoE(%)
EV/Sales(x)
(Č)
Price ( Č)
( Č cr )
FY17E
FY18E
FY17E
FY18E
FY17E
FY18E
FY17E
FY18E
FY17E
FY18E
FY17E
FY18E
FY17E
FY18E
Capital Goods
Voltas
Neutral
391
-
12,924
6,511
7,514
7.9
8.7
12.9
16.3
30.3
24.0
5.5
4.8
16.7
18.5
1.8
1.5
BGR Energy
Neutral
116
-
836
16,567
33,848
6.0
5.6
7.8
5.9
14.9
19.6
0.9
0.8
4.7
4.2
0.2
0.1
BHEL
Neutral
139
-
34,034
28,797
34,742
-
2.8
2.3
6.9
60.5
20.2
1.0
1.0
1.3
4.8
0.9
0.6
Blue Star
Accumulate
501
527
4,775
4,351
5,024
6.4
7.1
17.2
20.6
29.2
24.3
19.0
15.8
23.1
24.1
1.1
1.0
Crompton Greaves
Neutral
83
-
5,221
5,777
6,120
5.9
7.0
3.3
4.5
25.2
18.5
1.1
1.1
4.4
5.9
0.8
0.7
Greaves Cotton
Neutral
138
-
3,376
1,755
1,881
16.8
16.9
7.8
8.5
17.7
16.3
3.5
3.3
20.6
20.9
1.6
1.5
Inox Wind
Buy
188
286
4,178
5,605
6,267
15.7
16.4
24.8
30.0
7.6
6.3
2.1
1.6
25.9
24.4
0.8
0.6
KEC International
Neutral
135
-
3,476
9,294
10,186
7.9
8.1
9.9
11.9
13.7
11.4
2.0
1.7
15.6
16.3
0.6
0.6
Thermax
Neutral
837
-
9,974
5,421
5,940
7.3
7.3
25.7
30.2
32.6
27.7
3.9
3.6
12.2
13.1
1.7
1.6
VATech Wabag
Buy
569
681
3,102
3,136
3,845
8.9
9.1
26.0
35.9
21.9
15.9
2.7
2.3
13.4
15.9
0.9
0.7
Cement
ACC
Neutral
1,708
-
32,068
11,225
13,172
13.2
16.9
44.5
75.5
38.4
22.6
3.6
3.4
11.2
14.2
2.8
2.4
Ambuja Cements
Neutral
279
-
55,400
9,350
10,979
18.2
22.5
5.8
9.5
48.1
29.4
4.0
3.6
10.2
12.5
5.8
5.0
India Cements
Neutral
150
-
4,603
4,364
4,997
18.5
19.2
7.9
11.3
19.0
13.3
1.4
1.3
8.0
8.5
1.8
1.6
JK Cement
Neutral
792
-
5,539
4,398
5,173
15.5
17.5
31.2
55.5
25.4
14.3
3.1
2.6
12.0
15.5
1.8
1.5
J K Lakshmi Cement
Neutral
451
-
5,312
2,913
3,412
14.5
19.5
7.5
22.5
60.2
20.1
3.7
3.1
12.5
18.0
2.4
2.0
Orient Cement
Neutral
192
-
3,941
2,114
2,558
18.5
20.5
8.1
11.3
23.8
17.0
3.5
3.0
9.0
14.0
2.4
1.9
UltraTech Cement
Neutral
4,029
-
110,575
25,768
30,385
21.0
23.5
111.0
160.0
36.3
25.2
4.6
4.1
13.5
15.8
4.2
3.5
Construction
ITNL
Buy
74
93
2,428
8,946
10,017
31.0
31.6
8.1
9.1
9.1
8.1
0.3
0.3
4.2
5.0
3.6
3.3
KNR Constructions
Accumulate
717
802
2,017
1,385
1,673
14.7
14.0
41.2
48.5
17.4
14.8
3.3
2.8
14.9
15.2
1.5
1.2
Larsen & Toubro
Buy
1,514
1,700
141,092
67,665
77,249
10.7
11.5
57.3
71.2
26.4
21.3
2.4
2.3
12.6
14.3
2.2
1.9
Gujarat Pipavav Port
Neutral
178
-
8,603
705
788
52.2
51.7
5.0
5.6
35.6
31.8
3.5
3.2
11.2
11.2
11.9
10.1
Nagarjuna Const.
Neutral
85
-
4,714
8,842
9,775
9.1
8.8
5.3
6.4
16.0
13.3
1.3
1.2
8.2
9.1
0.7
0.6
PNC Infratech
Accumulate
122
129
3,117
2,350
2,904
13.4
13.7
48.0
42.0
2.5
2.9
0.5
0.4
16.8
13.2
1.4
1.2
Simplex Infra
Neutral
312
-
1,545
6,829
7,954
10.5
10.5
31.4
37.4
10.0
8.4
1.0
0.9
9.9
13.4
0.6
0.5
Power Mech Projects
Neutral
461
-
679
1,801
2,219
12.7
14.6
72.1
113.9
6.4
4.1
1.2
1.0
16.8
11.9
0.4
0.3
Sadbhav Engineering
Neutral
298
-
5,109
3,598
4,140
10.3
10.6
9.0
11.9
33.1
25.0
3.5
3.0
9.9
11.9
1.7
1.4
NBCC
Neutral
241
-
14,475
7,428
9,549
7.9
8.6
8.2
11.0
29.4
21.9
1.5
1.2
28.2
28.7
1.7
1.2
MEP Infra
Neutral
44
-
709
1,877
1,943
30.6
29.8
3.0
4.2
14.5
10.4
7.0
4.7
0.6
0.6
1.8
1.6
SIPL
Neutral
98
-
3,450
1,036
1,252
65.5
66.2
(8.4)
(5.6)
3.7
4.2
(22.8)
(15.9)
11.5
9.6
Stock Watch
September 01, 2016
Company Name
Reco
CMP
Target
Mkt Cap
Sales ( Čcr )
OPM(%)
EPS (Č)
PER(x)
P/BV(x)
RoE(%)
EV/Sales(x)
(Č)
Price ( Č)
( Č cr )
FY17E
FY18E
FY17E
FY18E
FY17E
FY18E
FY17E
FY18E
FY17E
FY18E
FY17E
FY18E
FY17E
FY18E
Construction
Engineers India
Neutral
262
-
8,814
1,725
1,935
16.0
19.1
11.4
13.9
23.0
18.8
3.2
3.1
13.4
15.3
4.1
3.7
Financials
Axis Bank
Neutral
596
-
142,167
58,081
66,459
3.5
3.5
32.4
44.6
18.4
13.3
2.4
2.1
13.6
16.5
-
-
Bank of Baroda
Neutral
163
-
37,523
19,980
23,178
1.8
1.8
11.5
17.3
14.2
9.4
1.6
1.3
8.3
10.1
-
-
Canara Bank
Neutral
280
-
15,220
15,225
16,836
1.8
1.8
14.5
28.0
19.3
10.0
1.3
1.1
5.8
8.5
-
-
Dewan Housing Finance Neutral
291
-
8,480
2,225
2,688
2.9
2.9
29.7
34.6
9.8
8.4
1.6
1.4
16.1
16.8
-
-
Equitas Holdings
Buy
178
235
5,976
939
1,281
11.7
11.5
5.8
8.2
30.7
21.7
2.6
2.4
10.9
11.5
-
-
Federal Bank
Neutral
69
-
11,821
9,353
10,623
2.9
2.9
4.4
5.8
15.6
11.9
1.5
1.3
9.5
11.0
-
-
HDFC
Neutral
1,406
-
222,307
11,475
13,450
3.4
3.4
45.3
52.5
31.0
26.8
6.0
5.3
20.2
20.5
-
-
HDFC Bank
Accumulate
1,291
1,350
326,784
46,097
55,433
4.5
4.5
58.4
68.0
22.1
19.0
3.9
3.2
18.8
18.6
-
-
ICICI Bank
Neutral
258
-
149,902
39,029
45,903
3.3
3.3
16.7
16.3
15.4
15.8
1.9
1.7
10.1
12.4
-
-
LIC Housing Finance
Neutral
573
-
28,905
3,712
4,293
2.6
2.5
39.0
46.0
14.7
12.5
2.8
2.4
19.9
20.1
-
-
Punjab Natl.Bank
Neutral
127
-
25,016
23,532
23,595
2.3
2.4
6.8
12.6
18.7
10.1
2.9
2.1
3.3
6.5
-
-
South Ind.Bank
Neutral
23
-
3,038
6,435
7,578
2.5
2.5
2.7
3.1
8.3
7.3
1.1
0.9
10.1
11.2
-
-
St Bk of India
Neutral
253
-
196,049
88,650
98,335
2.6
2.6
13.5
18.8
18.7
13.4
1.8
1.6
7.0
8.5
-
-
Union Bank
Neutral
142
-
9,731
13,450
14,925
2.3
2.3
25.5
34.5
5.6
4.1
0.8
0.7
7.5
10.2
-
-
Yes Bank
Neutral
1,363
-
57,374
8,978
11,281
3.3
3.4
74.0
90.0
18.4
15.1
3.5
3.0
17.0
17.2
-
-
FMCG
Asian Paints
Neutral
1,159
-
111,195
17,128
18,978
16.8
16.4
19.1
20.7
60.7
56.0
21.1
19.9
34.8
35.5
6.3
5.7
Britannia
Neutral
3,454
-
41,437
9,795
11,040
14.6
14.9
80.3
94.0
43.0
36.7
17.7
13.7
41.2
-
4.1
3.6
Colgate
Neutral
951
-
25,859
4,605
5,149
23.4
23.4
23.8
26.9
40.0
35.3
22.1
17.3
64.8
66.8
5.5
4.9
Dabur India
Neutral
291
-
51,138
8,315
9,405
19.8
20.7
8.1
9.2
35.9
31.6
10.0
8.3
31.6
31.0
5.9
5.2
GlaxoSmith Con*
Neutral
6,268
-
26,362
4,350
4,823
21.2
21.4
179.2
196.5
35.0
31.9
9.3
7.9
27.1
26.8
5.5
4.8
Godrej Consumer
Neutral
1,521
-
51,780
10,235
11,428
18.4
18.6
41.1
44.2
37.0
34.4
8.2
6.9
24.9
24.8
5.3
4.7
HUL
Neutral
917
-
198,386
35,252
38,495
17.6
17.4
20.4
21.9
44.9
41.9
36.9
32.3
82.2
77.3
5.5
5.0
ITC
Accumulate
260
283
313,901
40,059
44,439
39.0
39.2
9.1
10.1
28.6
25.8
7.8
6.8
27.2
26.5
7.2
6.5
Marico
Neutral
292
-
37,621
6,430
7,349
18.8
19.5
6.4
7.7
45.6
37.9
13.8
11.6
33.2
32.5
5.6
4.8
Nestle*
Neutral
6,560
-
63,244
10,073
11,807
20.7
21.5
124.8
154.2
52.6
42.5
21.6
19.4
34.8
36.7
6.2
5.3
Tata Global
Neutral
140
-
8,852
8,675
9,088
9.8
9.8
7.4
8.2
19.0
17.1
2.2
2.1
7.9
8.1
0.9
0.9
Procter & Gamble
Accumulate
6,700
7,369
21,748
2,939
3,342
23.2
23.0
146.2
163.7
45.8
40.9
102.6
98.4
25.3
23.5
6.8
5.9
Hygiene
IT
HCL Tech^
Buy
779
1,000
109,926
49,242
57,168
20.5
20.5
55.7
64.1
14.0
12.2
2.8
2.2
20.3
17.9
2.1
1.7
Stock Watch
September 01, 2016
Company Name
Reco
CMP
Target
Mkt Cap
Sales ( Čcr )
OPM(%)
EPS (Č)
PER(x)
P/BV(x)
RoE(%)
EV/Sales(x)
(Č)
Price ( Č)
( Č cr )
FY17E FY18E
FY17E
FY18E
FY17E
FY18E
FY17E
FY18E
FY17E
FY18E
FY17E
FY18E
FY17E
FY18E
IT
Infosys
Buy
1,037
1,370
238,147
69,934
79,025
27.5
27.5
64.8
72.0
16.0
14.4
3.5
3.2
22.0
22.3
2.9
2.5
TCS
Buy
2,513
3,004
495,080
121,684
136,286
27.3
27.3
135.0
150.1
18.6
16.7
6.2
5.7
33.2
33.9
3.9
3.4
Tech Mahindra
Buy
469
700
45,502
30,347
33,685
17.0
17.0
37.5
41.3
12.5
11.4
2.7
2.4
21.8
20.7
1.2
1.0
Wipro
Buy
491
680
121,188
51,631
55,822
21.7
17.9
35.9
36.9
13.7
13.3
2.9
2.6
19.0
18.1
2.0
1.8
Media
D B Corp
Neutral
411
-
7,557
2,297
2,590
27.4
28.2
21.0
23.4
19.6
17.6
4.6
4.0
23.7
23.1
3.1
2.7
HT Media
Neutral
83
-
1,932
2,693
2,991
12.6
12.9
7.9
9.0
10.5
9.2
0.9
0.8
7.8
8.3
0.3
0.2
Jagran Prakashan
Accumulate
190
205
6,223
2,355
2,635
28.0
28.0
9.9
10.8
19.2
17.6
3.8
3.3
21.7
21.7
2.6
2.3
Sun TV Network
Neutral
473
-
18,644
2,850
3,265
70.1
71.0
26.2
30.4
18.1
15.6
4.6
4.1
24.3
25.6
6.2
5.2
Hindustan Media
Neutral
287
-
2,110
1,016
1,138
24.3
25.2
27.3
30.1
10.5
9.6
2.0
1.8
16.2
15.8
1.4
1.2
Ventures
TV Today Network
Buy
308
363
1,837
637
743
27.5
27.5
18.4
21.4
16.8
14.4
2.9
2.5
17.4
17.2
2.5
2.0
Metals & Mining
Coal India
Neutral
334
-
210,745
84,638
94,297
21.4
22.3
24.5
27.1
13.6
12.3
5.7
5.4
42.6
46.0
2.0
1.8
Hind. Zinc
Neutral
227
-
95,809
14,252
18,465
55.9
48.3
15.8
21.5
14.4
10.6
2.3
2.0
17.0
20.7
6.8
5.2
Hindalco
Neutral
160
-
32,978
107,899
112,095
7.4
8.2
9.2
13.0
17.4
12.3
0.8
0.8
4.8
6.6
0.8
0.8
JSW Steel
Neutral
1,755
-
42,431
53,201
58,779
16.1
16.2
130.6
153.7
13.4
11.4
1.8
1.6
14.0
14.4
1.6
1.4
NMDC
Neutral
108
-
42,799
6,643
7,284
44.4
47.7
7.1
7.7
15.2
14.0
1.3
1.3
8.8
9.2
4.2
3.8
SAIL
Neutral
48
-
19,928
47,528
53,738
(0.7)
2.1
(1.9)
2.6
18.6
0.5
0.5
(1.6)
3.9
1.3
1.2
Vedanta
Neutral
170
-
50,400
71,744
81,944
19.2
21.7
13.4
20.1
12.7
8.5
1.1
1.0
8.4
11.3
1.1
0.8
Tata Steel
Neutral
370
-
35,979
121,374
121,856
7.2
8.4
18.6
34.3
19.9
10.8
1.2
1.1
6.1
10.1
0.9
0.9
Oil & Gas
Cairn India
Neutral
200
-
37,422
9,127
10,632
4.3
20.6
8.8
11.7
22.7
17.1
0.7
0.7
3.3
4.2
5.7
4.7
GAIL
Neutral
384
-
48,722
56,220
65,198
9.3
10.1
27.1
33.3
14.2
11.5
1.3
1.2
9.3
10.7
1.1
0.9
ONGC
Neutral
237
-
202,808
137,222
152,563
15.0
21.8
19.5
24.1
12.2
9.8
1.0
1.0
8.5
10.1
1.8
1.6
Indian Oil Corp
Neutral
575
-
139,704
373,359
428,656
5.9
5.5
54.0
59.3
10.7
9.7
1.7
1.5
16.0
15.6
0.5
0.5
Reliance Industries
Neutral
1,058
-
343,051
301,963
358,039
12.1
12.6
87.7
101.7
12.1
10.4
1.2
1.1
10.7
11.3
1.6
1.3
Pharmaceuticals
Alembic Pharma
Neutral
629
-
11,850
3,483
4,083
20.2
21.4
24.3
30.4
25.9
20.7
5.9
4.7
25.5
25.3
3.4
2.8
Aurobindo Pharma
Accumulate
791
877
46,266
15,720
18,078
23.7
23.7
41.4
47.3
19.1
16.7
5.0
3.9
29.6
26.1
3.2
2.8
Sanofi India*
Neutral
4,399
-
10,130
2,357
2,692
17.3
17.3
153.5
169.2
28.7
26.0
4.9
3.9
25.8
28.4
3.9
3.2
Cadila Healthcare
Neutral
381
-
38,969
11,126
13,148
22.0
22.0
17.1
20.0
22.3
19.0
5.7
4.5
28.8
26.6
3.6
2.9
Cipla
Sell
573
490
46,012
15,378
18,089
17.4
18.4
21.6
27.2
26.5
21.1
3.4
3.0
13.7
15.2
3.2
2.7
Dr Reddy's
Neutral
3,089
-
52,687
16,043
18,119
23.1
24.7
126.0
157.8
24.5
19.6
3.6
3.1
15.7
17.1
3.2
2.8
Stock Watch
September 01, 2016
Company Name
Reco
CMP
Target
Mkt Cap
Sales ( Čcr )
OPM(%)
EPS (Č)
PER(x)
P/BV(x)
RoE(%)
EV/Sales(x)
(Č)
Price ( Č)
( Č cr )
FY17E FY18E
FY17E
FY18E
FY17E
FY18E
FY17E
FY18E
FY17E
FY18E
FY17E
FY18E
FY17E
FY18E
Pharmaceuticals
Dishman Pharma
Sell
177
45
2,850
1,718
1,890
22.7
22.8
9.5
11.3
18.6
15.6
1.8
1.6
10.1
10.9
2.2
1.9
GSK Pharma*
Neutral
3,035
-
25,707
3,528
3,811
16.6
18.8
51.8
59.4
58.6
51.1
15.7
15.6
26.3
30.6
7.0
6.5
Indoco Remedies
Sell
315
225
2,906
1,112
1,289
18.2
18.2
13.2
15.6
23.9
20.2
4.2
3.6
19.2
19.2
2.8
2.4
Ipca labs
Accumulate
541
613
6,826
3,303
3,799
15.3
15.3
17.3
19.7
31.3
27.5
2.7
2.5
9.1
9.4
2.2
1.9
Lupin
Buy
1,484
1,809
66,889
15,912
18,644
26.4
26.7
58.1
69.3
25.5
21.4
5.0
4.1
21.4
20.9
4.4
3.6
Sun Pharma
Buy
775
944
186,483
31,129
35,258
30.0
30.9
28.0
32.8
27.7
23.6
4.3
3.5
18.7
18.9
5.6
4.7
Power
Tata Power
Neutral
79
-
21,231
36,916
39,557
17.4
27.1
5.1
6.3
15.4
12.5
1.4
1.2
9.0
10.3
1.6
1.4
NTPC
Neutral
159
-
131,309
86,605
95,545
17.5
20.8
11.8
13.4
13.5
11.9
1.4
1.3
10.5
11.1
2.9
2.9
Power Grid
Neutral
184
-
96,261
25,763
29,762
74.3
73.1
14.8
17.3
12.4
10.6
1.9
1.7
16.9
17.5
8.0
7.6
Real Estate
MLIFE
Buy
433
522
1,776
1,152
1,300
22.7
24.6
29.9
35.8
14.5
12.1
1.1
1.0
7.6
8.6
2.3
1.9
Telecom
Bharti Airtel
Neutral
332
-
132,654
105,086
114,808
34.5
34.7
12.2
16.4
27.2
20.2
1.8
1.7
6.8
8.4
2.2
1.9
Idea Cellular
Neutral
94
-
33,668
40,133
43,731
37.2
37.1
6.4
6.5
14.6
14.4
1.2
1.1
8.2
7.6
1.9
1.6
zOthers
Abbott India
Neutral
4,666
-
9,914
3,153
3,583
14.1
14.4
152.2
182.7
30.7
25.5
150.5
128.5
25.6
26.1
2.9
2.5
Bajaj Electricals
Neutral
266
-
2,690
5,099
5,805
5.7
5.9
11.4
14.6
23.4
18.3
3.1
2.8
13.4
15.1
0.5
0.5
Finolex Cables
Neutral
444
-
6,787
2,883
3,115
12.0
12.1
14.2
18.6
31.3
23.9
16.6
14.5
15.8
14.6
2.0
1.8
Goodyear India*
Accumulate
562
631
1,296
1,598
1,704
10.4
10.2
49.4
52.6
11.4
10.7
52.5
46.1
18.2
17.0
0.5
64.3
Hitachi
Neutral
1,537
-
4,179
2,081
2,433
8.8
8.9
33.4
39.9
46.0
38.5
37.1
30.9
22.1
21.4
2.0
1.7
Jyothy Laboratories
Neutral
308
-
5,579
1,440
2,052
11.5
13.0
8.5
10.0
36.2
30.8
8.8
8.1
18.6
19.3
4.2
2.9
Page Industries
Neutral
14,791
-
16,497
2,450
3,124
20.1
17.6
299.0
310.0
49.5
47.7
329.4
251.5
47.1
87.5
6.8
5.4
Relaxo Footwears
Neutral
459
-
5,513
2,085
2,469
9.2
8.2
7.6
8.0
60.8
57.8
23.6
20.1
17.9
18.8
2.7
2.3
Siyaram Silk Mills
Neutral
1,344
-
1,260
1,799
2,040
11.6
11.7
104.9
122.4
12.8
11.0
2.1
1.8
16.4
16.4
0.9
0.8
Styrolution ABS India*
Neutral
568
-
998
1,440
1,537
9.2
9.0
40.6
42.6
14.0
13.3
35.7
32.5
12.3
11.6
0.7
0.6
TVS Srichakra
Accumulate
2,601
2,932
1,992
2,304
2,614
13.7
13.8
231.1
266.6
11.3
9.8
292.3
230.1
33.9
29.3
0.9
0.7
HSIL
Neutral
348
-
2,514
2,384
2,515
15.8
16.3
15.3
19.4
22.7
17.9
22.6
19.4
7.8
9.3
1.2
1.1
Kirloskar Engines India
Neutral
281
-
4,058
2,554
2,800
9.9
10.0
10.5
12.1
26.7
23.2
11.2
10.6
10.7
11.7
1.2
1.1
Ltd
M M Forgings
Neutral
430
-
519
546
608
20.4
20.7
41.3
48.7
10.4
8.8
58.9
52.1
16.6
17.0
0.8
0.7
Banco Products (India)
Neutral
216
-
1,546
1,353
1,471
12.3
12.4
14.5
16.3
14.9
13.3
20.6
18.6
14.5
14.6
1.1
115.4
Competent Automobiles Neutral
184
-
113
1,137
1,256
3.1
2.7
28.0
23.6
6.6
7.8
35.3
31.9
14.3
11.5
0.1
0.1
Nilkamal
Neutral
1,245
-
1,859
1,995
2,165
10.7
10.4
69.8
80.6
17.8
15.5
71.2
61.8
16.6
16.5
0.9
0.8
Stock Watch
September 01, 2016
Company Name
Reco
CMP
Target
Mkt Cap
Sales ( Čcr )
OPM(%)
EPS (Č)
PER(x)
P/BV(x)
RoE(%)
EV/Sales(x)
(Č)
Price ( Č)
( Č cr )
FY17E
FY18E
FY17E
FY18E
FY17E
FY18E
FY17E
FY18E
FY17E
FY18E
FY17E
FY18E
FY17E
FY18E
zOthers
Visaka Industries
Neutral
181
-
288
1,051
1,138
10.3
10.4
21.0
23.1
8.6
7.8
23.2
21.8
9.0
9.2
0.5
0.5
Transport Corporation of
Neutral
183
-
1,401
2,671
2,911
8.5
8.8
13.9
15.7
13.2
11.7
1.8
1.6
13.7
13.8
0.6
0.6
India
Elecon Engineering
Accumulate
57
63
624
1,482
1,660
13.7
14.5
3.9
5.8
14.7
9.9
3.5
3.2
7.8
10.9
0.7
0.7
Surya Roshni
Accumulate
185
201
809
3,342
3,625
7.8
7.5
17.3
19.8
10.7
9.4
20.3
16.3
10.5
10.8
0.5
0.4
MT Educare
Neutral
137
-
545
366
417
17.7
18.2
9.4
10.8
14.6
12.7
3.2
2.8
22.2
22.3
1.4
1.2
Radico Khaitan
Buy
105
125
1,391
1,659
1,802
13.0
13.2
6.3
7.4
16.5
14.2
1.4
1.3
8.6
9.3
1.3
1.2
Garware Wall Ropes
Accumulate
475
524
1,039
873
938
12.9
13.1
30.9
34.9
15.4
13.6
2.4
2.1
15.7
15.2
1.1
1.0
Wonderla Holidays
Neutral
404
-
2,281
287
355
38.0
40.0
11.3
14.2
35.7
28.4
5.1
4.5
21.4
23.9
7.7
6.3
Linc Pen & Plastics
Neutral
285
-
421
382
420
9.3
9.5
13.5
15.7
21.2
18.1
3.6
3.1
17.1
17.3
1.1
1.0
The Byke Hospitality
Neutral
160
-
642
287
384
20.5
20.5
7.6
10.7
21.1
15.0
4.4
3.6
20.7
23.5
2.2
1.7
Interglobe Aviation
Neutral
883
-
31,805
21,122
26,005
14.5
27.6
110.7
132.1
8.0
6.7
47.7
34.1
168.5
201.1
1.5
1.2
Coffee Day Enterprises
Neutral
246
-
5,070
2,964
3,260
20.5
21.2
4.7
8.0
-
30.8
2.8
2.6
5.5
8.5
2.1
1.9
Ltd
Navneet Education
Neutral
104
-
2,477
1,062
1,147
24.0
24.0
6.1
6.6
17.1
15.7
3.5
3.1
20.6
19.8
2.4
2.2
Navkar Corporation
Buy
197
265
2,809
408
612
42.9
42.3
6.8
11.5
29.1
17.1
2.0
1.8
6.9
10.5
7.8
5.2
UFO Moviez
Neutral
477
-
1,317
619
685
33.2
33.4
30.0
34.9
15.9
13.7
2.2
1.9
13.8
13.9
1.8
1.5
VRL Logistics
Neutral
292
-
2,666
1,902
2,119
16.7
16.6
14.6
16.8
20.1
17.4
4.4
3.9
21.9
22.2
1.5
1.3
Team Lease Serv.
Neutral
1,101
-
1,882
3,229
4,001
1.5
1.8
22.8
32.8
48.4
33.5
5.2
4.5
10.7
13.4
0.5
0.4
S H Kelkar & Co.
Neutral
342
-
4,942
1,036
1,160
15.1
15.0
6.1
7.2
56.0
47.6
6.0
5.5
10.7
11.5
4.6
4.0
Quick Heal
Neutral
242
-
1,693
408
495
27.3
27.0
7.7
8.8
31.2
27.5
2.9
2.9
9.3
10.6
3.3
2.7
Narayana Hrudaya
Neutral
310
-
6,330
1,873
2,166
11.5
11.7
2.6
4.0
117.1
78.1
7.2
6.5
6.1
8.3
3.5
3.0
Manpasand Bever.
Neutral
737
-
3,688
836
1,087
19.6
19.4
16.9
23.8
43.6
30.9
5.2
4.6
12.0
14.8
4.2
3.2
Parag Milk Foods
Neutral
326
-
2,745
1,919
2,231
9.3
9.6
9.5
12.9
34.6
25.2
5.4
4.4
15.5
17.5
1.6
1.3
Source: Company, Angel Research; Note: *December year end; #September year end; &October year end; Price as on August 31, 2016
Market Outlook
September 01, 2016
Research Team Tel: 022 - 39357800
DISCLAIMER
Angel Broking Private Limited (hereinafter referred to as “Angel”) is a registered Member of National Stock Exchange of India
Limited,Bombay Stock Exchange Limited and Metropolitan Stock Exchange Limited. It is also registered as a Depository Participant with
CDSL and Portfolio Manager with SEBI. It also has registration with AMFI as a Mutual Fund Distributor. Angel Broking Private Limited is a
registered entity with SEBI for Research Analyst in terms of SEBI (Research Analyst) Regulations, 2014 vide registration number
INH000000164. Angel or its associates has not been debarred/ suspended by SEBI or any other regulatory authority for accessing
/dealing in securities Market. Angel or its associates/analyst has not received any compensation / managed or
co-managed public offering of securities of the company covered by Analyst during the past twelve months.
This document is solely for the personal information of the recipient, and must not be singularly used as the basis of any investment
decision. Nothing in this document should be construed as investment or financial advice. Each recipient of this document should make
such investigations as they deem necessary to arrive at an independent evaluation of an investment in the securities of the companies
referred to in this document (including the merits and risks involved), and should consult their own advisors to determine the merits and
risks of such an investment.
Reports based on technical and derivative analysis center on studying charts of a stock's price movement, outstanding positions and
trading volume, as opposed to focusing on a company's fundamentals and, as such, may not match with a report on a company's
fundamentals. Investors are advised to refer the Fundamental and Technical Research Reports available on our website to evaluate the
contrary view, if any.
The information in this document has been printed on the basis of publicly available information, internal data and other reliable
sources believed to be true, but we do not represent that it is accurate or complete and it should not be relied on as such, as this
document is for general guidance only. Angel Broking Pvt. Limited or any of its affiliates/ group companies shall not be in any way
responsible for any loss or damage that may arise to any person from any inadvertent error in the information contained in this report.
Angel Broking Pvt. Limited has not independently verified all the information contained within this document. Accordingly, we cannot
testify, nor make any representation or warranty, express or implied, to the accuracy, contents or data contained within this document.
While Angel Broking Pvt. Limited endeavors to update on a reasonable basis the information discussed in this material, there may be
regulatory, compliance, or other reasons that prevent us from doing so.
This document is being supplied to you solely for your information, and its contents, information or data may not be reproduced,
redistributed or passed on, directly or indirectly.
Neither Angel Broking Pvt. Limited, nor its directors, employees or affiliates shall be liable for any loss or damage that may arise from
or in connection with the use of this information.